Workplace Noise Mapping
Grid-based
Spatial sampling
Zone-ready
Marking & signage
Control-led
Prioritised sources
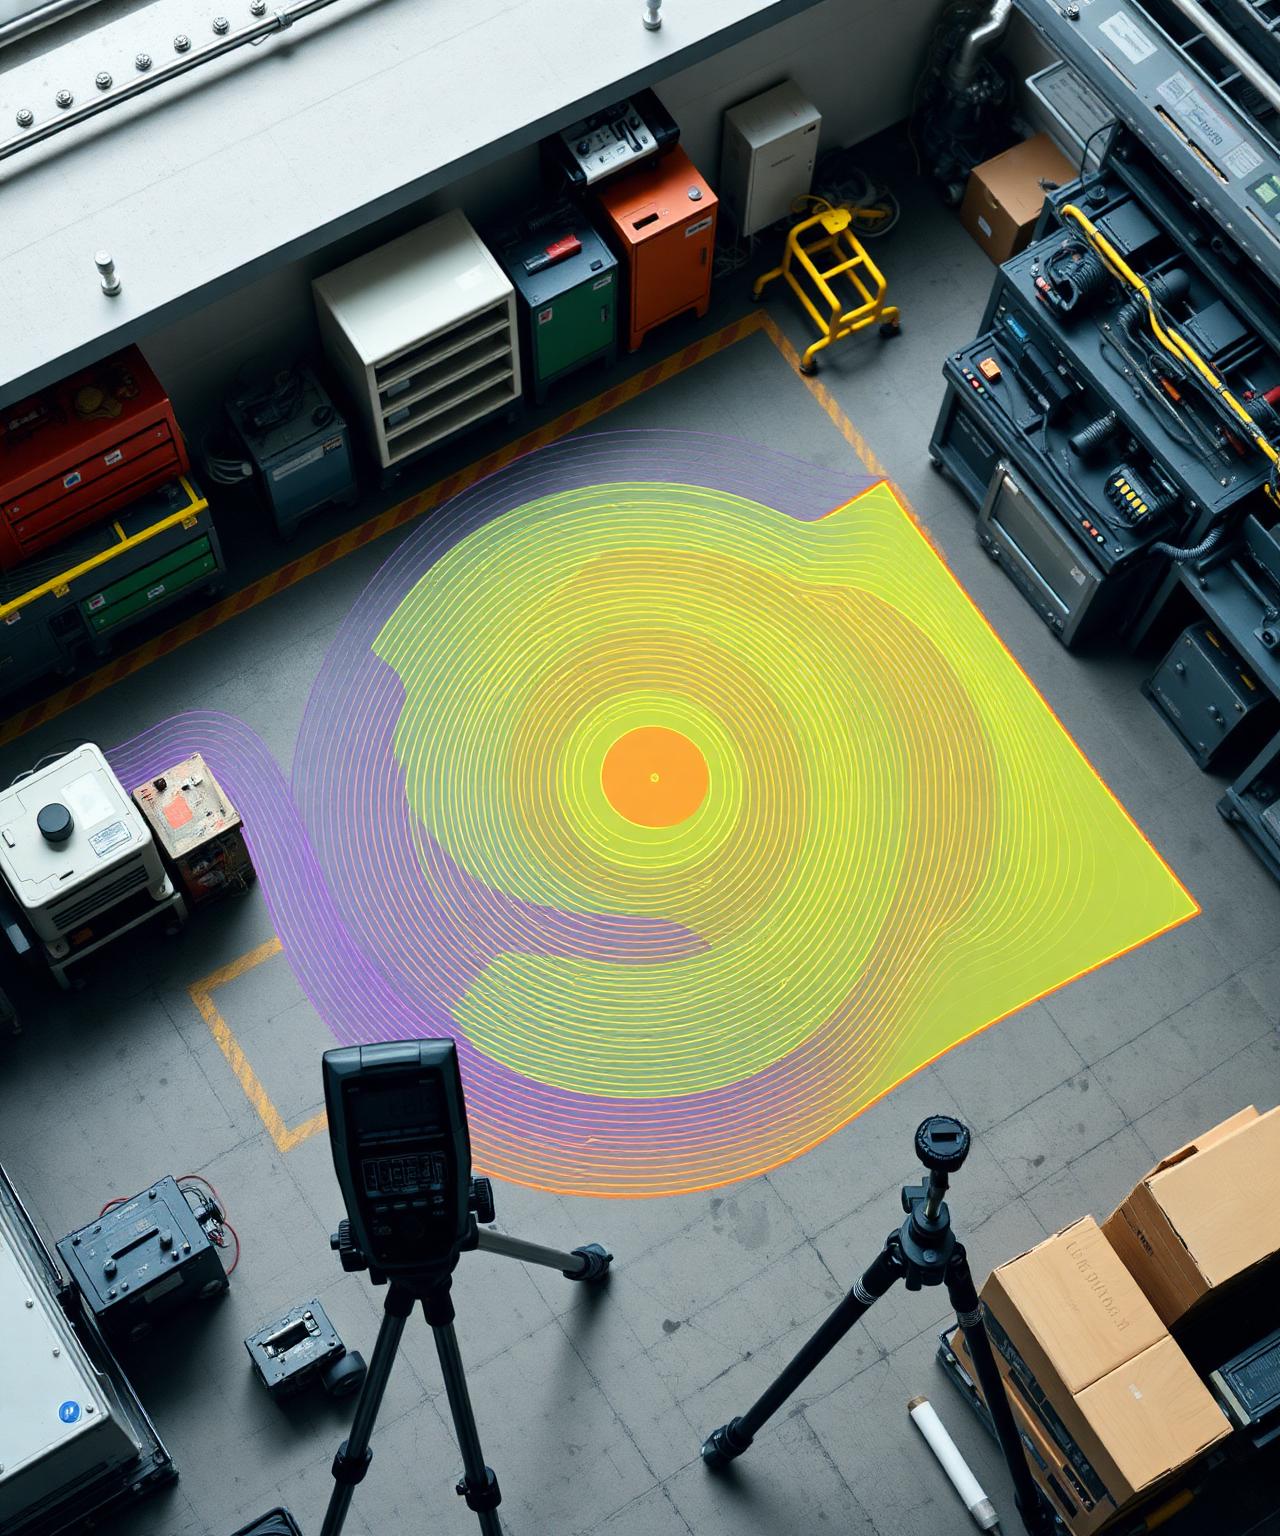
Spatial noise mapping
Contours · zones · sources
What it is
Spatial mapping of workplace noise
A workplace noise map turns numbers into a picture: where in the building the noise actually is, how it distributes, and how the workforce moves through it. It is one of the most useful tools available for marking hearing-protection zones credibly and for prioritising engineering control.
Noise mapping is complementary to noise exposure assessment and workplace noise surveys, and especially to factory noise surveys.
Method
How the map is built
- Grid layout sized to the floor area
- Measurement at each grid point
- Extra sampling around dominant sources
- Sampling along access and walk routes
- Representative operating combinations
- Octave-band data where useful
- Interpolation to contour bands
Outputs
What you can do with the map
Hearing protection zones
Rational zone boundaries based on actual measured contours, not guesswork.
Control prioritisation
Identify which sources to address first to reduce exposure across the largest area.
Layout decisions
Inform machine layout, partitioning and operator-position decisions during change projects.
Communication
A visual document workers, supervisors and management understand at a glance.
Use cases
When noise mapping is the right tool
- Marking hearing-protection zones
- Open-plan production halls
- Multi-machine cells
- Mixed-use workshops
- Plant rooms and utility spaces
- Layout-change planning
- Investigation of complaints
- Verification of acoustic treatment
Deliverables
Deliverables
- Annotated contour map (PDF / CAD overlay)
- Zone proposal with thresholds
- Dominant-source narrative
- Octave-band sub-maps where requested
- Measurement records and calibration
- Recommended monitoring points for future review
FAQ
Workplace noise mapping — frequently asked questions
What is workplace noise mapping?+
Workplace noise mapping is a spatial representation of sound levels across a work area. Measurements taken on a grid of positions across the floor are interpolated into a contour map showing where exposure is highest, where hearing-protection zones should be marked and where engineering controls would have most effect.
How is it different from an exposure assessment?+
Exposure assessment is about people — the LEX,8h of each worker or similar exposure group. Noise mapping is about places — where in the building the noise is, how it distributes and how it changes when sources operate together. The two are complementary.
Does the map show hearing-protection zones?+
Yes. The map identifies areas where the upper exposure action value is met or exceeded, so hearing-protection zones can be marked rationally rather than by guesswork.
How are measurement positions chosen?+
On a regular grid sized to the area, with extra positions around dominant sources and along access routes. We avoid the temptation to over-sample loud machines and under-sample circulation space — both matter for zoning and for control prioritisation.
Does the map account for multiple sources running together?+
Yes. Maps are produced for representative operating combinations, not just for a single source. Where production runs vary substantially, separate maps may be produced for different operating states.
What does the deliverable look like?+
An annotated floor-plan contour map showing levels in dB(A) bands, with hearing-protection zone proposals, dominant sources highlighted and a short interpretation. Where helpful, octave-band sub-maps support engineering control design.